Web GUI and Policies
This guide specifies the user-facing behaviour and policy model. New readers should first consult Getting started; API consumers should use Using collected data, and the system rationale appears in Architecture and data flows.
The screenshots use representative demonstration stations and accounts. Names, timestamps, measurements, and email addresses are examples; the controls and page layout are those of the running application.
After login, the next return URL must be a local path beginning with a single
/. External URLs, backslashes, and control characters fall back to the home page.
Enable
Set (see configuration):
{
  "pathStorage": "/data/storage",
  "httpHost": "0.0.0.0",
  "httpPort": 8080,
  "databaseUrl": "",
  "webSessionSecret": "replace-with-strong-secret"
}
Core routes
/home/map/login,POST /logout/forgot-password/reset-password?token=.../request-account/request-account/complete?token=.../change-password/fast-login?token=...single-use login link; withnext=notificationsit continues to/profile#notifications/station/<uuid>station data page: chart, table, statistics, downloads/station/<uuid>/export.csvCSV of the selected time range/station/<uuid>/chart-settingsstation trend-chart Y-axis settings/station/<uuid>/chart-settings/export/station/<uuid>/chart-settings/import/public/station/<uuid>public station dashboard (not forrestrictedstations, see below)/manifest.webmanifest,/service-worker.js, versioned/pwa/icon-v<version>-<size>.png, and/offlineprogressive web app assets/static/js/<page>.js,/static/css/<page>.cssscript and stylesheet of each page (revalidated by the browser on every load, gzip-compressed)/api/public/station/<uuid>/snapshotJSON polled by the public dashboard/api/check-username?username=...&token=...username availability for the onboarding form; needs a valid onboarding token, otherwise403/api/admin/dashboardJSON polled by the admin network dashboard/api/queryauthenticated JSON query API/api/downloadauthenticated raw-hourly-file ZIP API/api-tokens,/api/tokensAPI-token dashboard and CRUD API/workflows,/api/workflowsnode workflow editor and CRUD API/adminadmin console/admin/dashboardadmin-only network dashboard/admin/access-logadmin-only access/download statistics, filters, charts and event table/admin/access-log/export.csvCSV export of the filtered access log/anomaliesanomaly log and silence actions/profileuser profile: notification time and the user's notifications/profile/notification-interval,/profile/notifications/<id>(POST) profile actions
Progressive web app
The portal can be installed on phones and desktops ("Add to Home screen" / "Install app").
- every page is an HTML5 document (
<!doctype html>) and carries the manifest link, theme colour, and icons; they come from the sharedbase.htmltemplate that all pages extend - the manifest uses
webAppNameandwebAppShortName(default short name:network.meteo@uniarthenope); the icons (180, 192, 512 px PNG, also maskable) are resized from the configured application icon, whose bundled default is derived from the meteo@uniparthenope logo - the primary, secondary and accent brand colours are configured with
webThemePrimary,webThemeSecondaryandwebThemeAccent; the primary colour is also applied to the manifest, browser chrome and generated install icon - browsers that support it show a Bootstrap
Install appbutton in the bottom-right corner; a Bootstrap alert appears while the device is offline - the service worker precaches the offline shell, core same-origin portal styles/scripts, manifest and icons; CDN assets such as Bootstrap, Leaflet, and Chart.js use the browser's normal network and HTTP cache path
- pages and
/api/responses are never cached, because they depend on the logged-in user and on live data; when a page cannot be loaded the offline page is shown - installation needs a secure context: HTTPS, or
http://localhostduring development - the service worker scope is the application root; behind a reverse proxy serve the application at the root of its host name
Home page previews
The home page station map and browse/download list use a lightweight latest-sample preview per station. They show the latest known station name, position, and timestamp without scanning the full historical archive, so the home page stays responsive even with large CSV storage trees.
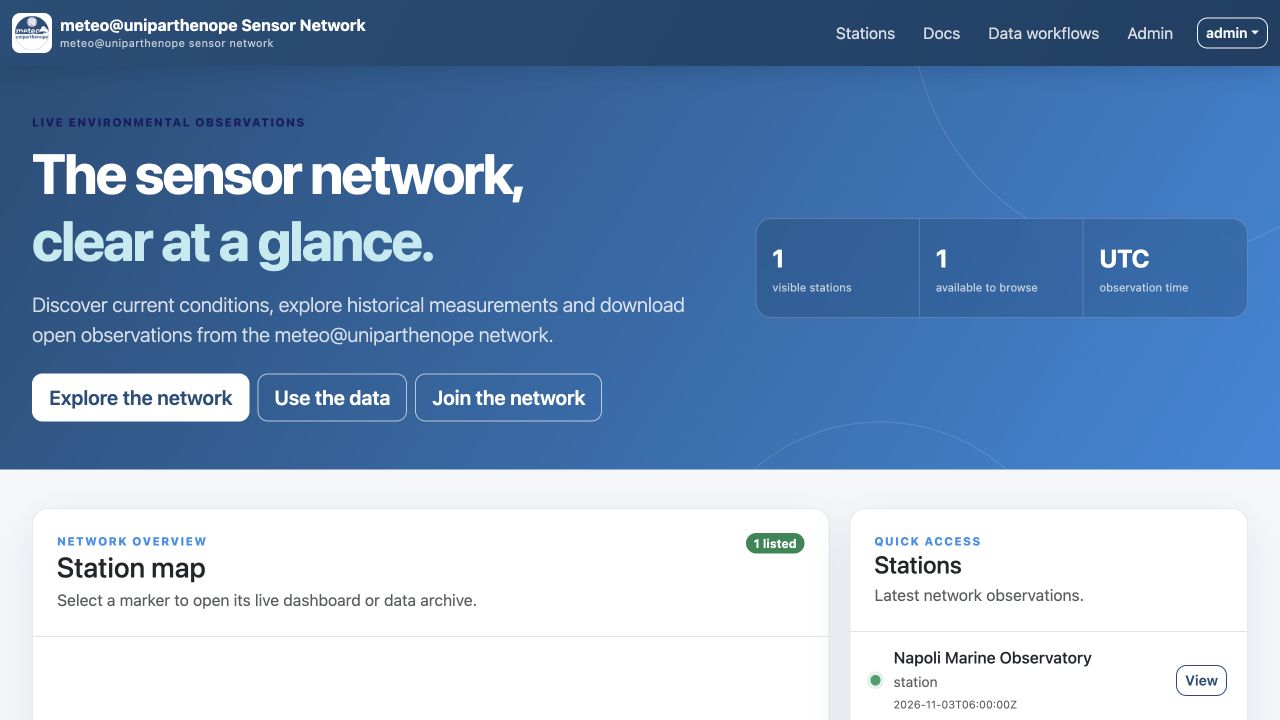
The opening view keeps discovery and current conditions above the fold. After sign-in, the same page adds the permitted station archive and download controls below the station cards.
Stations map
- the map zooms to show every station that has coordinates; stations with missing or invalid coordinates are listed but not drawn
- hovering a marker shows the station name; clicking it opens a popup with the UUID, policy, time of the last data, an
Open dashboardbutton and, when permitted, a data-browsing button - green markers can be browsed by the current user; CSV download is a separate permission
Performance
- station data is read by hour: a dashboard reads only the hourly files overlapping its trend window, located through the
YYYY/MM/DDdirectories, so response time does not grow with the length of the archive - the admin dashboard and the watchdog read the newest files of each station only
- the public dashboard polls every 5 seconds with the timestamp it already shows; while the station has not stored a newer row the answer is
{"changed": false}, without rebuilding the trends - when InfluxDB is enabled it is queried from the start of the displayed window
- HTML, JSON and JavaScript responses larger than 1 kB are gzip-compressed for browsers that accept it (a reverse proxy does not need to compress them again)
- the station data page embeds each series once; on ranges with more than 3000 rows the chart shows an evenly thinned series (the page says how many samples are skipped) while the table, the statistics and the CSV use every row
- the station data table shows at most 1000 rows per page; whole ranges are downloaded as CSV
Access policies
Regular users receive no station rights when their account is created. Administrators
assign two independent rights per station: Browse permits viewing past data, charts,
tables and statistics; Download CSV permits exporting a chosen interval with selected
columns (and therefore also permits browsing that interval). Administrators always have
both rights.
Can API and Can workflows are separate account permissions. Can API permits a
regular user to call the data API and manage API tokens. Can workflows permits the
user to open the workflow editor and create, change, delete, and run workflows. Neither
permission bypasses station rights, and administrators implicitly have both. API
queries and workflow station nodes require Browse access; API downloads require
Download access.
The station visibility policy remains separate:
open: browser data views/downloads need no station assignment; the protected data API still requires a logged-in account withCan APIaccount: the dashboard is visible, but historical data still requires an assignmentrestricted: the station is hidden except from explicitly assigned users
Server-side permission checks are enforced separately for browsing and downloads.
Public station dashboards follow the policy too: stations with the open or account
policy have a dashboard anyone can read, while a restricted station is hidden from
users who are not assigned to it (and are not admins). For them it is absent from the
home-page map and lists, /public/station/<uuid> asks anonymous visitors to log in and
answers 404 otherwise, and its snapshot API answers 404.
If an unauthenticated user opens a protected page, the web app redirects to /login and shows an alert explaining that authentication is required. The original destination is preserved in next=... and is reopened after successful login.
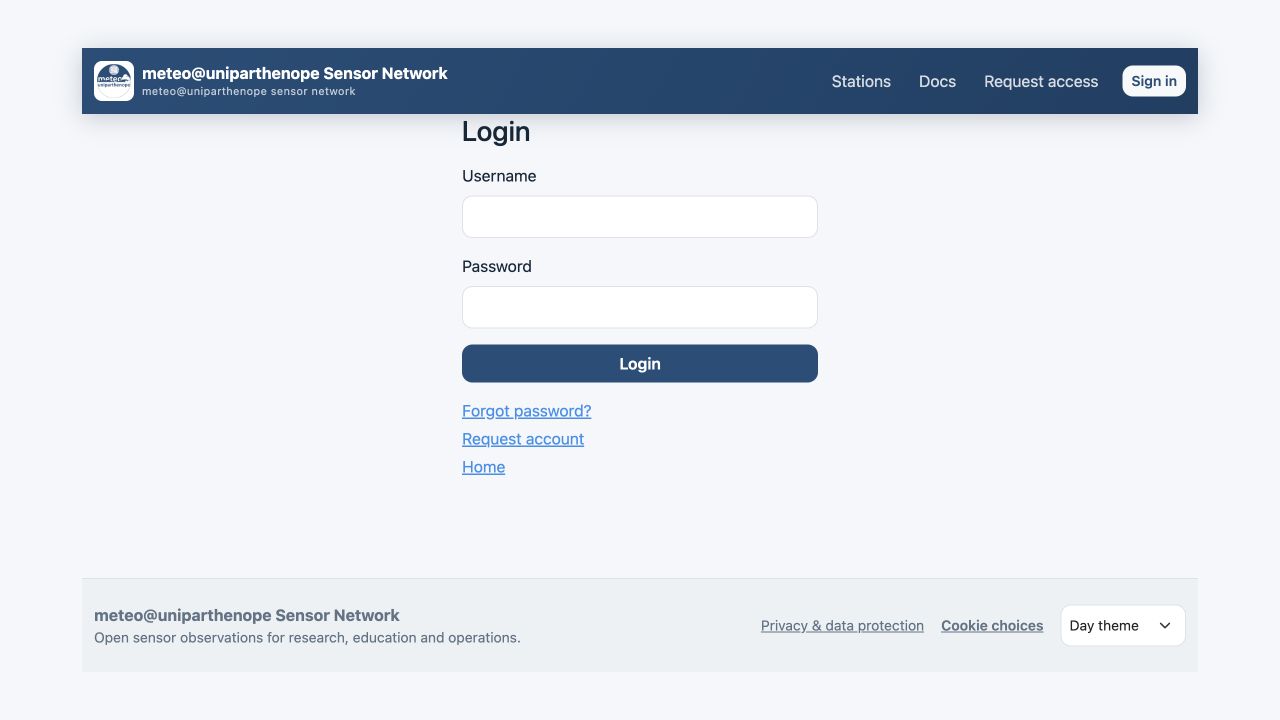
The sign-in card deliberately keeps recovery and account-request paths beside the credentials form. The shared header, footer, theme selector, and privacy controls remain available before authentication.
Administration page
/admin has three tabs; every action reports its result at the top of the page and
returns to the tab it was started from (/admin#users, /admin#stations,
/admin#requests).
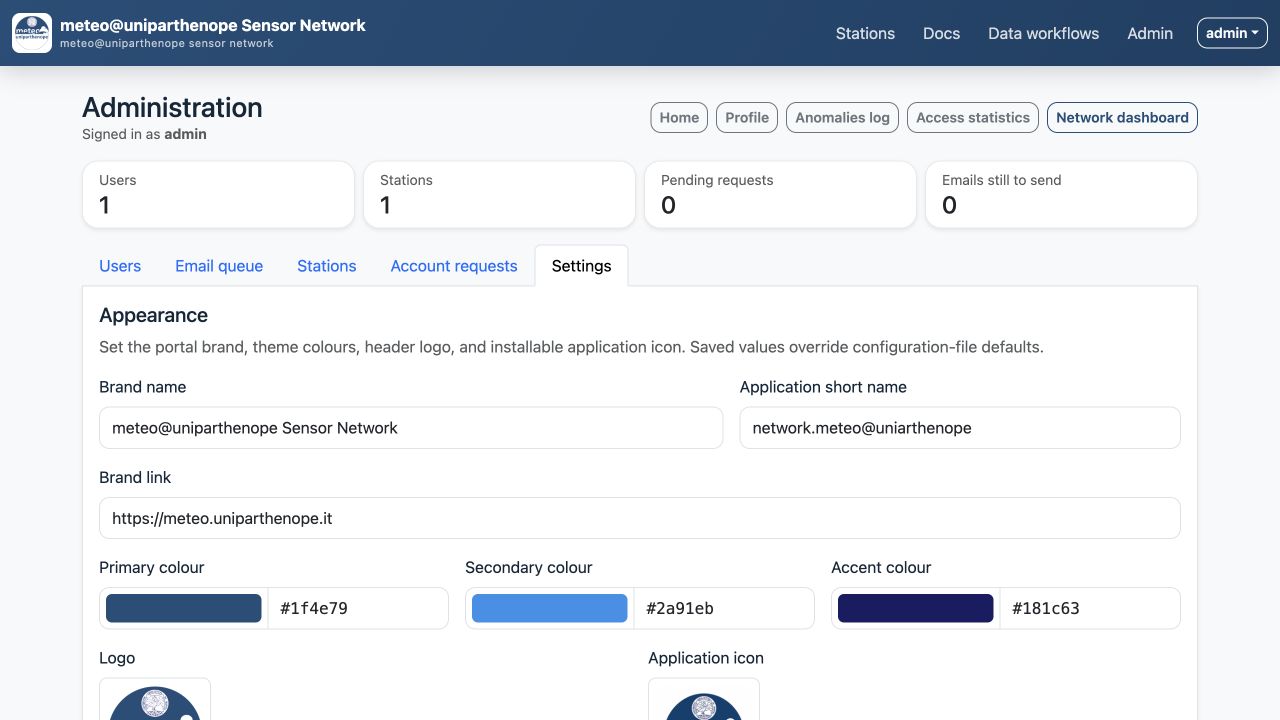
The summary cards give administrators an immediate count of users, stations, pending requests, and queued email. The tabs beneath them keep user, station, request, and mail-queue operations on one page; the screenshot shows the user overview.
- Users: searchable list with role, status, and a summary of station rights.
New useropens the creation form (the password rules are shown; "ask for a new password at the first login" is ticked by default).Manageopens, for one user: - a table of all stations with separate
Browse,Download CSV, andChart settingscheckboxes; a newly created regular user has none of these rights - separate
Can APIandCan workflowscontrols: the first governs the protected data API and API tokens, while the second governs the editor and workflow execution - account actions: change the email, assign a strong password (optionally requiring another change at next login), ask for or stop asking for a new password, make administrator / regular user, disable / enable, rename or delete the account, stop that user's alert emails, or impersonate an active account. An impersonation banner remains visible on every page and returns the administrator to their own session; starts and ends are recorded in the auth DB
- Stations: add, rename, remove or restore a portal station; view its UUID, time of the last data, policy (saved as soon as it is
changed), how many users have rights, and links to the dashboard, the data browser
and the chart settings.
Usersopens the same rights table seen from the station: one row per regular user. Removing a station is non-destructive: its collector-owned CSV history remains on disk. - Alert email stop: alert emails can be stopped for one user from their account controls or for every user with the button above the user list. In-app notification records are retained.
- Account requests: pending requests with
ApproveandReject. When no email can be sent, the onboarding link (valid 48 hours) is shown to the administrator after approval so that it can be passed on by other means. - Email queue: counts emails already sent and still to send, and shows the recent recipients, subjects, attempts, next retry or delivery time, and SMTP errors.
Rules enforced by the server:
- a disabled account cannot log in and its open sessions stop working
- administrators cannot disable or demote their own account, and the last active administrator cannot be disabled or demoted
- administrators have every right on every station, so they have no rights table
Form endpoints (all POST, admin only): /admin/create-user, /admin/user-update,
/admin/user-rename, /admin/user-delete, /admin/user-notifications,
/admin/notifications/stop-all, /admin/stations/save, /admin/stations/delete,
/admin/stations/restore,
/admin/user-permissions, /admin/station-permissions, /admin/policy,
/admin/user-api, /admin/force-password, /admin/set-password, /admin/requests/<id>/approve, /admin/requests/<id>/reject,
and the single-assignment /admin/user-access and /admin/user-control.
Data API and workflows
The complete, canonical reference is Workflows and data API. The
running application renders that same Markdown file at /docs/workflows-api, linked
from the home, workflow, and API-token pages. The summary below is retained as an
overview of the surrounding web-interface policies.
Data and workflow API endpoints accept either the logged-in web session or
Authorization: Bearer <token>. They return 401 when authentication is missing or
invalid and 403 when Can API, Can workflows, or station rights required by the
specific endpoint are missing.
GET /api/query?station=<uuid>[,<uuid>]&from=<ISO>&to=<ISO>&fields=<field>[,<field>]&limit=1000returns time-ordered JSON rows. The limit is capped at 10,000 rows per station.GET /api/download?station=<uuid>[,<uuid>]&from=<ISO>&to=<ISO>returns a ZIP containing the original hourly CSV files.fromandtoare optional UTC ISO-8601 timestamps.GET /api/workflows,POST /api/workflows,PUT /api/workflows/<id>andDELETE /api/workflows/<id>manage only the logged-in user's workflows.
API tokens
Users with Can API (and administrators, implicitly) manage their own tokens at
/api-tokens. The workflow toolbar links to token management only for those users;
workflow-only accounts keep the editor without an inaccessible token-management link.
The session-only CRUD endpoints are:
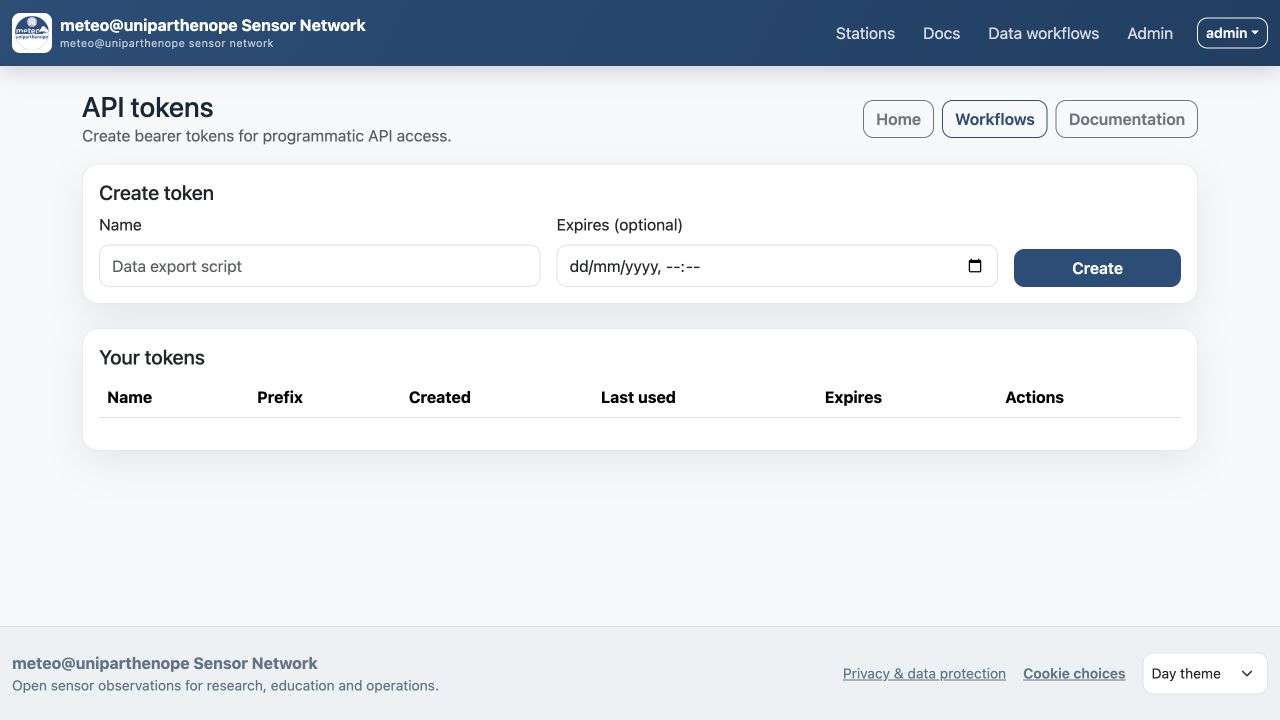
The creation form returns a secret once. The list below it subsequently shows only safe metadata such as the token name, prefix, expiry, and last-use time, together with the edit and revoke controls.
GET /api/tokensandGET /api/tokens/<id>POST /api/tokenswith{"name":"Exporter","expires_at":"2026-12-31T23:59:59Z"}PUT /api/tokens/<id>with a new name and optional expiryDELETE /api/tokens/<id>to revoke the token immediately
expires_at is optional but, when supplied, must be a future ISO-8601 timestamp.
The complete token is returned only by POST; later reads expose only its prefix and
metadata. The database stores a SHA-256 hash, not the credential. Use a token as follows:
curl -H 'Authorization: Bearer snp_REPLACE_WITH_TOKEN' \
  'https://portal.example.org/api/query?station=station-a&limit=100'
Disabling the account or revoking Can API immediately stops all of its tokens. Tokens
inherit the owner's current station Browse and Download permissions. Bearer credentials
cannot access /api/tokens; token CRUD deliberately requires a logged-in web session.
For example:
GET /api/query?station=station-a,station-b&from=2026-10-15T00:00:00Z&to=2026-10-15T12:00:00Z&fields=RainRate,TempOut&limit=1000
The response groups rows by station. CSV values remain JSON strings, matching their
stored representation, and each projected row retains timestamp when it exists:
{
  "from": "2026-10-15T00:00:00Z",
  "to": "2026-10-15T12:00:00Z",
  "stations": [
    {
      "station": "station-a",
      "rows": [{"timestamp": "2026-10-15T11:59:00Z", "RainRate": "301.2"}]
    }
  ]
}
station is required and accepts a comma-separated list. from, to, and fields
are optional. Bounds are UTC when their ISO value has no offset. to must not precede
from; limit defaults to 1,000 and is clamped to 1–10,000 per station. The query
result applies exact timestamp bounds. A ZIP download instead contains each original
hourly file overlapping the bounds, so boundary files are not rewritten to remove
individual rows.
Workflow create/update bodies have this shape:
{
  "name": "Extreme rain email",
  "enabled": true,
  "graph": {
    "nodes": [
      {"id": "rain", "type": "station", "x": 40, "y": 80,
       "data": {"station": "station-a"}},
      {"id": "heavy", "type": "condition", "x": 280, "y": 80,
       "data": {"field": "RainRate", "operator": ">", "value": 300}},
      {"id": "notify", "type": "email", "x": 520, "y": 80,
       "data": {"recipient": "alerts@example.org"}}
    ],
    "edges": [
      {"source": "rain", "target": "heavy"},
      {"source": "heavy", "target": "notify"}
    ]
  }
}
Node IDs must be unique. Each condition has one or more station inputs; it is true when
any connected station's newest reading satisfies the comparison. Each email has one
or more condition inputs. Supported operators are >, >=, <, <=, ==, and
!=. Graphs are limited to 50 nodes and 100 edges. Station nodes may reference public
stations or stations the owner can browse. Recipients must be syntactically valid email
addresses. Arbitrary code, HTTP requests, shell commands, and custom node types are not
accepted.
The /workflows editor uses Node-RED-style nodes and wires. The supported, intentionally
bounded node catalogue is Station input → numeric Condition → Send email. For example,
connect a station to RainRate > 300, then connect that condition to an email node.
Several station nodes can feed the same condition to apply one threshold to all of
them; the aggregate condition fires when it changes from no matching stations to at
least one matching station.
Use the × button to remove a node and its connections. Select a wire to change its source or target, or remove the connection. The current graph can be downloaded as SVG, PNG, or JPG from the editor toolbar; raster exports are rendered at 2× resolution.
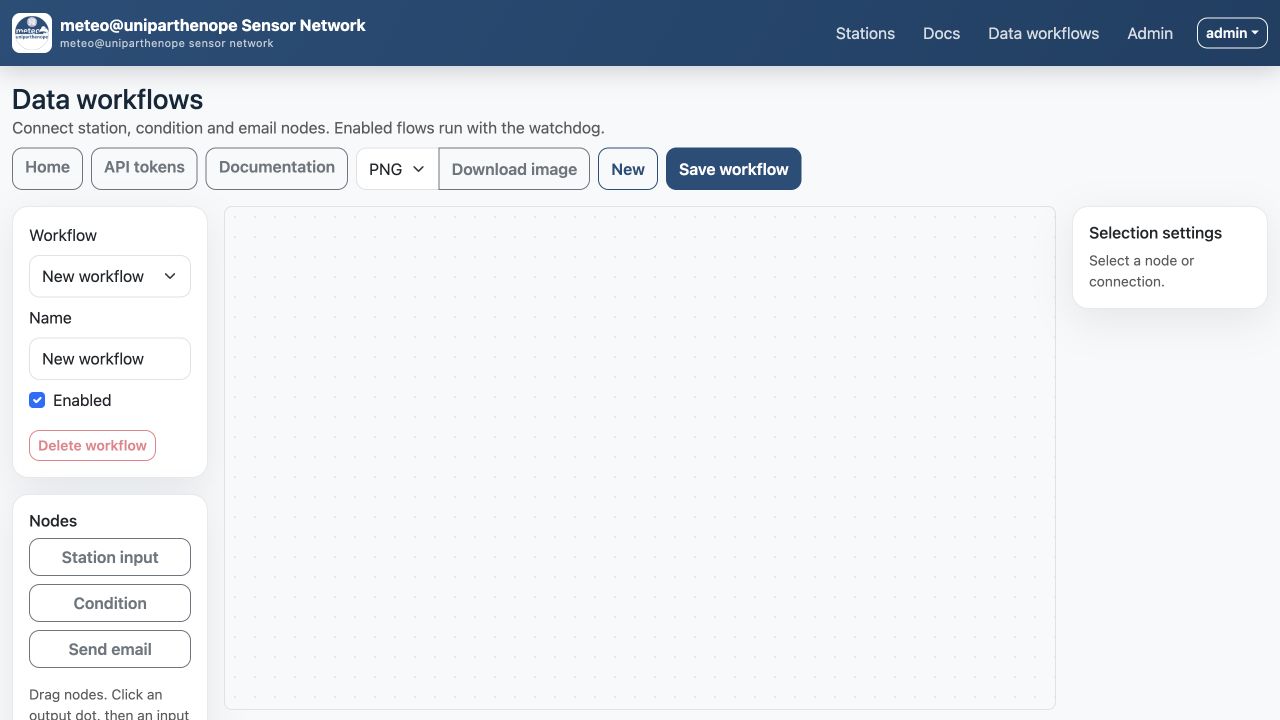
The watchdog evaluates enabled flows using the newest stored sample. An email is sent
only when the condition changes from false to true; it becomes eligible again after
the condition becomes false. Workflows run only while their owner is active, retains
Can workflows, and can still browse every referenced station. SMTP uses the existing mail
configuration. Run exactly one watchdog process to avoid duplicate event evaluation.
The workflow list also exposes last_run_at and last_error for operational diagnosis.
Changing or deleting a workflow is restricted to its owner, including for administrators.
Chart control rights
Chart setup rights are separate from download/browse rights.
- admins can edit trend-chart settings for every station
- non-admin users can edit a station chart setup only if they have explicit chart-control rights for that station
- chart-control rights are assigned from
/admin(theChart settingscolumn of the rights tables)
This is used for the Public Station Dashboard trend charts only.
Station data page
/station/<uuid> is the page for browsing, plotting and downloading the data of one
station. It needs Browse permission; anonymous visitors of a non-open station
are sent to the login page.
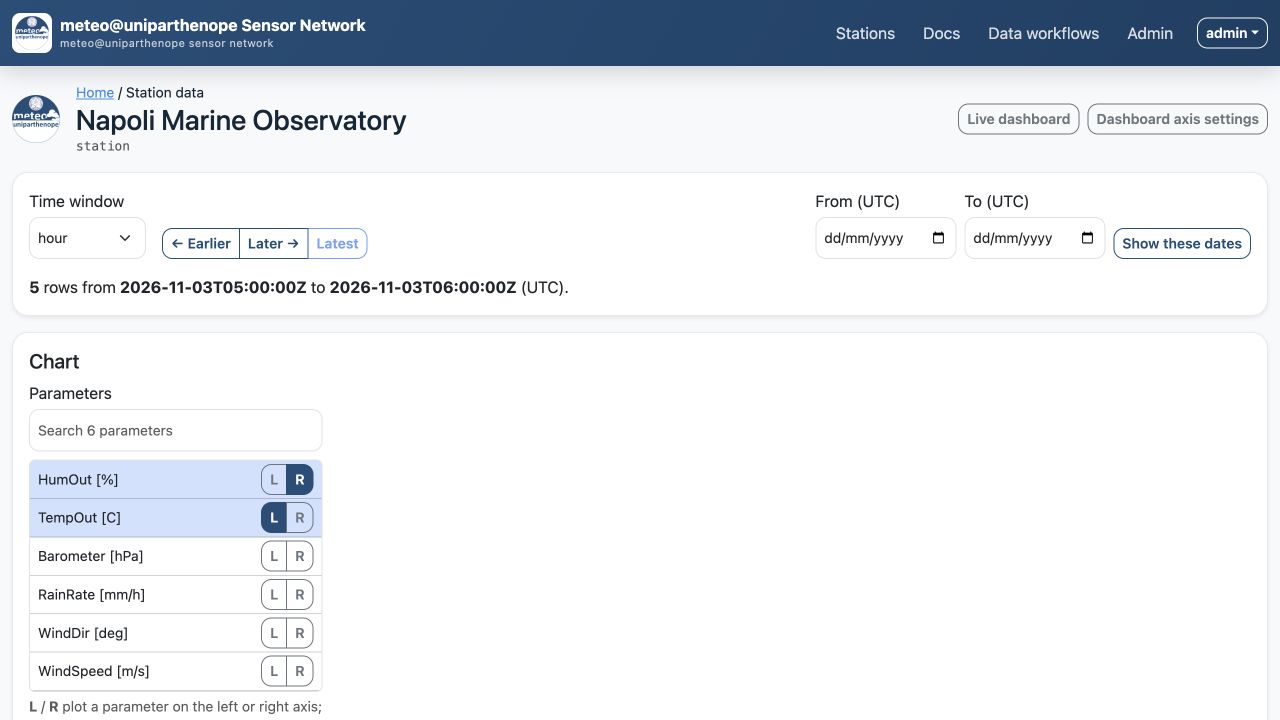
The upper part of the page combines time navigation and plot configuration so a user can change the interval and series without losing context. The data table and range statistics follow below the chart, while download actions appear only when the user also has Download CSV permission.
Units shown follow the raw MQTT/storage field units, not the Signal K converted metadata
units (WindDir is shown as deg even if the Signal K path uses rad).
Time range
Time windowselects the length (from one minute to one week);EarlierandLatermove by one window andLatestreturns to the newest data. The chosen length is remembered in a cookie.Show these datesselects whole UTC days instead, at most 31 days. Longer periods are available as raw files (see below).- The latest window ends at the newest row of the station.
- A range without data shows a notice and keeps the navigation, instead of jumping to other data.
Chart
Parameterslists every numeric parameter of the range with a search box.LandRplot a parameter on the left or right axis; pressing the active button removes it. Plotted parameters are listed first.- Parameters with the same unit on the same side share one axis, so that for example three temperatures use a single scale. Parameters without a unit get an axis each.
- Each plotted series has a colour, a type (line or bars), its axis side and a
Removebutton. Each axis has optionalMin,MaxandStep; empty fields are automatic and follow the data when the time range changes.Auto rangeclears them. - The time axis is linear in time (gaps in the data appear as gaps) and labelled in UTC.
- On ranges with more than 3000 rows the chart shows an evenly thinned series and the page says so; the table, the statistics and the CSV files keep every row.
- The chart setup is remembered per station in the browser (
localStorage).Save chart setup/Load chart setupwrite and read it as a JSON file, also to move it to another browser.
Publication-quality plots
Download plot… exports the chart as shown, with these options:
- figure size: single column (90 × 60 mm), 1.5 columns (140 × 85 mm), double column (190 × 100 mm), or 16:9 slide (254 × 143 mm)
- font (sans-serif or serif) and text size in points, optional title, legend and grid
- black and white: black lines with different dash patterns and grey bars
Download SVG (vector): a standalone SVG with the physical size set, real text and no raster content; it can be edited or converted to PDF/EPSDownload PNG: a white-background image at 300, 600 or 1200 dpi whose file records the resolution, so it imports at the chosen physical size
Both are produced in the browser; nothing is sent to the server.
Data table and downloads
The table is available with Browse permission. The following export controls are shown only with Download CSV permission:
Download this range (CSV): one CSV file with every row of the selected range and the columns currently shown (/station/<uuid>/export.csv, which takes the sameinterval/anchororfrom_date/to_datearguments as the page and optional repeatedcolarguments)Plotted data (CSV): the same, limited to the timestamp and the plotted parametersRaw files (ZIP)…: the original hourly files for any period, pre-filled with the dates of the rangeRows per page(50, 100, 250, 1000) andOrder(oldest or newest first) are remembered in cookies; the pager has first, previous, next and lastColumnsshows or hides columns, withShow allandOnly timestamp and plotted; the choice is remembered per station in the browserStatistics of this rangelists, for every numeric parameter, the number of samples, minimum and maximum with their times, mean and standard deviation, over all rows of the range
Public station chart axis settings
The Public Station Dashboard supports per-station Y-axis configuration for each trend chart.
Available settings per chart:
y_miny_maxy_step
Behavior:
- when all three values are empty, the dashboard computes a best-fit automatic axis range and interval
- when one or more values are set, the saved values override the automatic Y-axis calculation for that station/chart
y_stepcontrols the chart tick interval on the Y-axis- saved settings are read from the application database and applied to the public dashboard without requiring configuration-file changes
Management flow:
- open
/station/<uuid>/chart-settings - edit values for one or more charts
- leave fields empty to keep automatic sizing
- save changes
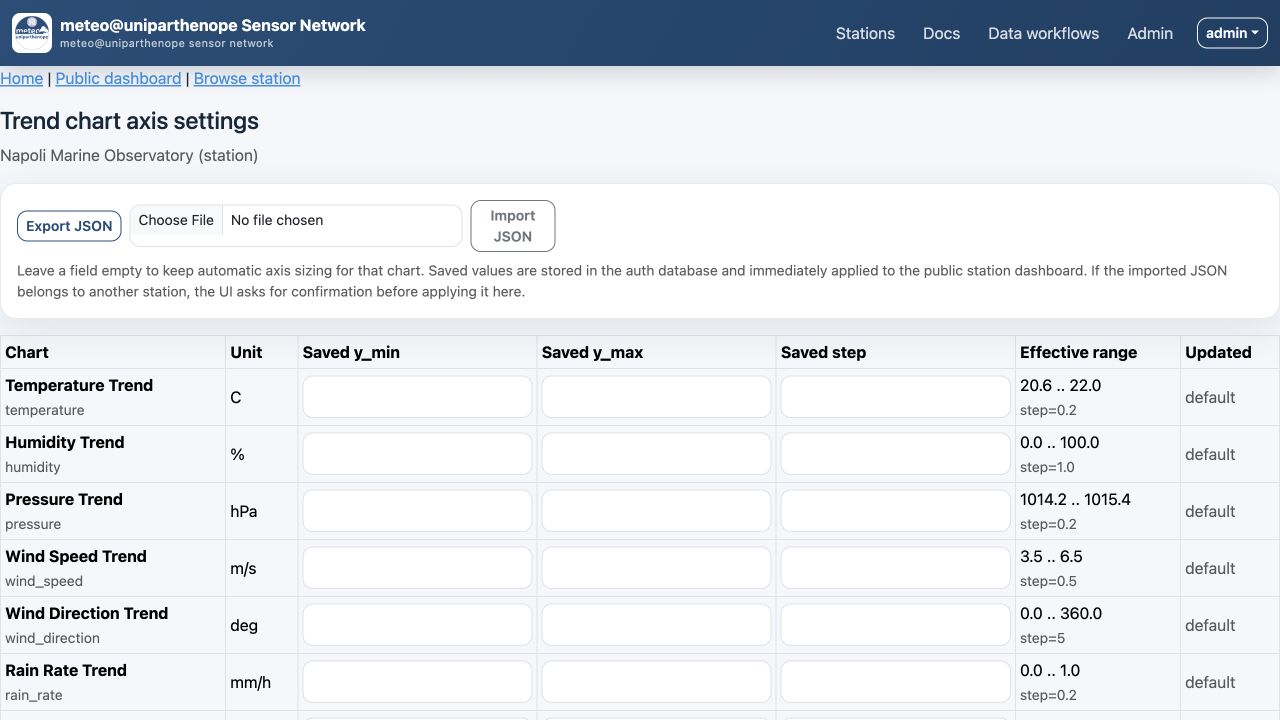
Each row pairs the configured minimum, maximum, and tick step with the effective values currently used by the public dashboard. This makes it possible to compare a manual override with the automatic range before exporting or copying the setup.
The page also shows:
- current effective Y-axis range used by the dashboard
- current effective Y-axis step
- last update timestamp and user who changed the setting
Import and export of chart settings
Each station chart setup can be exported/imported as JSON.
Routes:
- export:
/station/<uuid>/chart-settings/export - import:
/station/<uuid>/chart-settings/import
Use cases:
- copy the same chart policy between environments
- back up a station dashboard setup
- version-control station chart settings outside the application database
JSON payload structure:
{
  "station_uuid": "it.uniparthenope.meteo.ws1",
  "exported_at": "2026-03-12T12:00:00Z",
  "series": {
    "temperature": {
      "label": "Temperature Trend",
      "unit": "C",
      "y_min": 0,
      "y_max": 40,
      "y_step": 5
    },
    "humidity": {
      "label": "Humidity Trend",
      "unit": "%",
      "y_min": 0,
      "y_max": 100,
      "y_step": 10
    }
  }
}
Import rules:
- the file must contain a
seriesobject - unknown chart keys are ignored
y_stepmust be positive- if both
y_minandy_maxare provided,y_maxmust be greater thany_min - if
station_uuidis present in the JSON and differs from the current station, the web UI prompts the user for confirmation before importing it into the current station - the server accepts a cross-station import only when that explicit confirmation flag is sent from the form
This allows reusing the same chart setup across stations while still protecting against accidental imports into the wrong station.
User lifecycle and emails
With SMTP enabled:
- registration request confirmation email
- welcome email when admin creates user
- account approval email with onboarding link when request is approved
- password-reset email from forgot-password flow
- station failure, reminder, and recovery emails to admins and station-related users (see Failure notifications)
- workflow email actions to the address configured in an email node
SMTP fallback behavior:
- if
smtpHostis missing, emails are skipped - if
smtpPort,smtpUser, andsmtpPassare omitted, the app uses unauthenticated SMTP on port25
Password management
- admin can assign a strong password to any user and can force another password change
- forced users are redirected to
/change-passwordat login and on every other page until the password is changed; form submissions and/api/calls return403 Password change requiredmeanwhile - logging in starts a fresh session; sessions of inactive accounts are ignored
- users can request a password reset from
/forgot-password - reset links are delivered by email and open
/reset-password?token=... - reset flow requires a valid
baseUrland working SMTP configuration - reset, fast-login, and onboarding links are single use; a reset link stays valid if the submitted password is rejected
- all new passwords must be strong, including those set from
/change-passwordand/reset-password: - at least 12 characters
- at least one uppercase letter
- at least one lowercase letter
- at least one digit
- at least one special character
Account requests and onboarding
The self-service account request flow is:
- requester opens
/request-account - requester submits only email and reason
- request is saved as pending and admins receive an email notification
- admin approves or rejects the request in
/admin - if approved, the requester receives a one-time onboarding link
- requester opens
/request-account/complete?token=... - requester chooses a unique username and a strong password
Behavior details:
- username availability is checked immediately from the browser
- if a username already exists, the page shows an inline error and also blocks submission server-side
- onboarding links are expiring, single-use tokens
Anomaly log and silencing
- anomalies are persisted in the application database
- admins see full log
- non-admin users see only stations they can access
- users can silence specific anomalies for 1..24 hours; this stops the failure and reminder emails of that anomaly for every user
- an anomaly is closed when the watchdog has not seen it for 5 minutes (or three scan periods, if longer), so a condition that comes and goes between scans stays one anomaly
Failure notifications
The watchdog emails the admins and the users a station's policy admits (account: every
user, restricted: the assigned users). Emails are sent:
- when a station goes from regular to failure (a new anomaly)
- when it goes from failure back to regular, to the users who were told of the failure
- while the failure persists, as a reminder at each notification time of the user
Checks in between send nothing. All the events owed to a user in one scan go into one
email. Each email carries a single-use link, valid for 60 minutes, that logs the user in
and opens /profile#notifications; a link opened later leads there through the login
form.
On /profile every user:
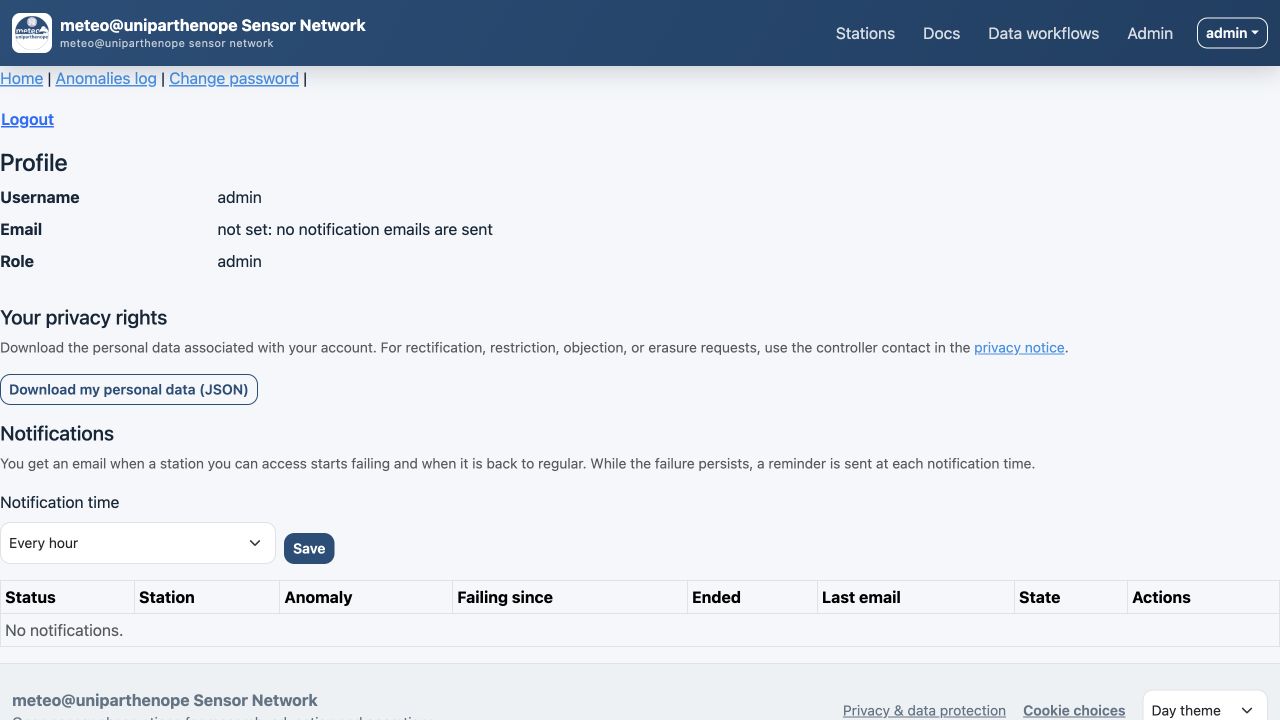
The profile keeps the reminder interval and the user's current station notifications together. Acknowledging, snoozing, or clearing an entry changes only that user's delivery state; it does not silence the underlying anomaly for other users.
- chooses the notification time from a drop-down list: no email notifications, status changes only (no reminders), 15 or 30 minutes, 1, 2, 3, 6, 12, or 24 hours. The default is 60 minutes. With email disabled, failures remain visible in the profile, but failure, reminder, and recovery emails are suppressed
- sees the list of their notifications and, for each one, can:
- Acknowledge: no more reminders for that failure; the recovery is still notified
- Snooze (1, 4, 8, or 24 hours): reminders pause and then resume
- Clear: remove it from the list; no more emails about it
These actions affect only the user's own emails. A user without an email address still gets the list. If an email cannot be sent, it is retried at the next scan. Notification delivery is claimed atomically in the auth database, so watchdog containers that briefly overlap during a restart do not send duplicate failures or reminders. An abandoned claim expires after five minutes if a watchdog stops before delivery.
Branding and logos
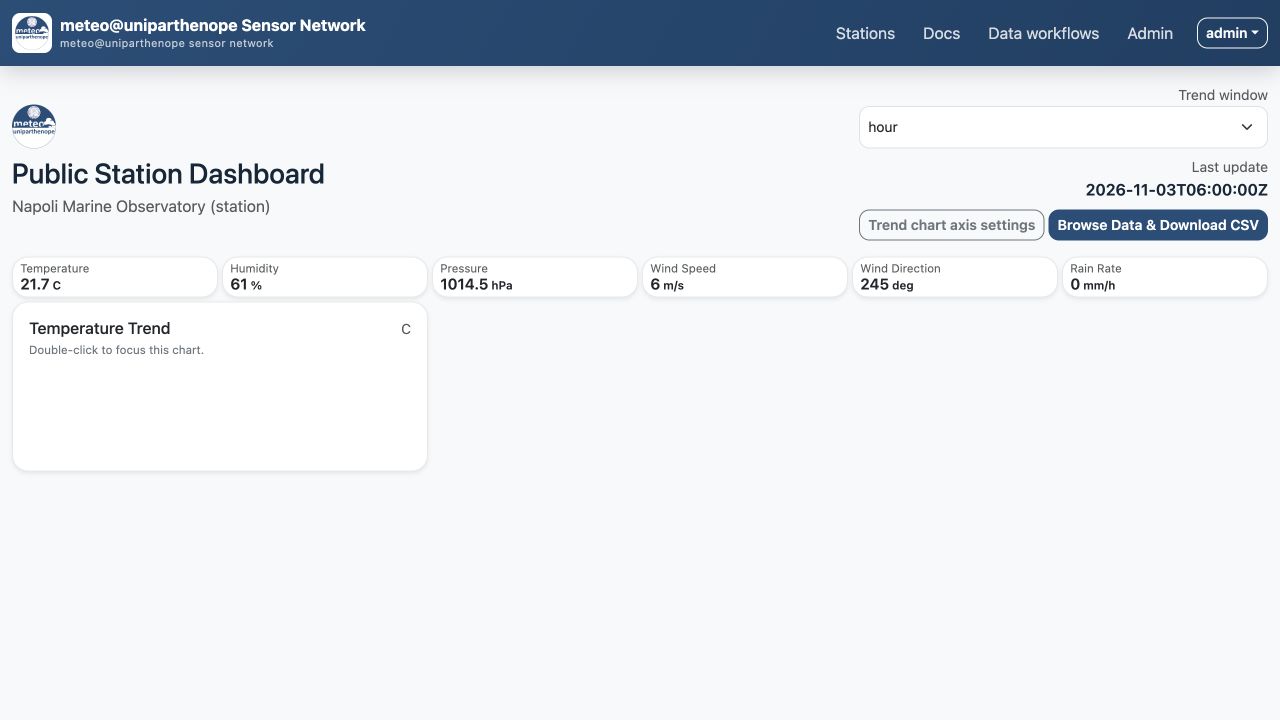
The public view combines the configured portal branding with the station identity,
current values, trend-window selector, and responsive chart grid. It is the page opened
by Open dashboard on the home map and station cards.
- the bundled logo, application icon, brand names, link, and theme colours reproduce the meteo@uniparthenope identity by default
- administrators manage brand, theme colours, logo, and application icon together in Administration → Settings → Appearance; values are saved in the application database and take effect immediately
webAppLogosets the global app logo andwebAppIconsets the install iconwebAppLinkcan wrap the home-page logo with an external hyperlinkwebInfoLinkcan add anInfolink on the home page beforeLogin- station users can upload per-station logo from station page (PNG, JPEG, GIF, WebP, or SVG)
- uploads are limited to 25 MB per request
- logo files are served with a sandboxing
Content-Security-Policy, so scripts embedded in an SVG never run - public station page shows app logo + station logo together
- public station dashboard trend charts update in-place without full page reload
- the cards show the latest value of each metric, looking back up to 10 rows when the newest row lacks it; this keeps all cards visible for stations whose devices (for example weather and air quality) report in separate rows
- time-axis labels are level, with the date on a second line where the day changes; only the labels that fit side by side are drawn, always including the newest time, which leaves most of the card height to the plot
- the title of a focused chart (double-click) names the trend window currently displayed
- existing chart instances are reused and updated with fresh points and axes instead of being recreated on each polling cycle
- each public trend chart shows parameter units on the Y-axis
- public station dashboard trend window can be selected as:
- last minute
- 10 minutes
- hour
- 3 hours
- 6 hours
- 12 hours
- 24 hours
- 72 hours
- one week
- public station dashboard remembers selected trend window in a browser cookie
- station dashboard also remembers selected trend interval in a browser cookie
- when a public dashboard trend window is changed, trend chart x-axis is recomputed to match the selected time window
- when the plotted range crosses a day boundary, the x-axis prints the full date at the tick where the day changes
- public station dashboard trend chart Y-axis settings are loaded per station from the application database
- Y-axis step size is applied directly to chart ticks when configured
- public station dashboard includes a combined
Windtrend chart with: - wind direction as a line on the left Y-axis
- wind speed as bars on the right Y-axis
- axis ranges aligned with the dedicated wind direction and wind speed trend charts
- double-clicking a trend chart toggles a focused full-screen view for that chart
- double-clicking again restores the normal multi-chart layout
- pressing
Escalso exits the focused chart view - the focused chart state can be opened directly with query string
focus=<chart_key> - the selected trend window is shown next to the chart title only while the chart is focused full screen
- in focused mode the chart title shows the parameter name followed by the selected trend window
- in focused mode the top of the chart view shows:
- web app logo
- station name centered, without UUID
- station logo
- when a chart is focused, the page shows compact numeric widgets horizontally below the chart for the selected trend window:
- current
- min
- max
- the focused bottom stats bar is sized to keep current, min, and max visible within the viewport
- min and max widgets also show the date and time when those values occurred
- multi-series charts display one set of min/max/current values per sub-series
Admin dashboard behavior
Admin dashboard groups fields by domain (Atmosphere/Wind/Rain/AQ/etc.) and highlights missing sensor values.
Connectivity alarms are based on dynamic threshold:
- station marked failing when latest data age >
2 * usual update interval
Application database contents
The auth database now stores:
- users, including the global
Can APIandCan workflowsflags - account requests
- station visibility policies
- per-user Browse and Download assignments
- per-user station chart-control rights
- user-owned workflow graphs, enabled state, last-run errors, and node firing state
- hashed user-owned API tokens, labels, expiry, and last-used timestamps
- login and password-reset tokens
- anomalies and anomaly silence windows
- per-user notification time and notifications
- administrator impersonation start/end audit events
- user sign-in, station access, query and data-download audit events
- station logos
- appearance overrides (brand, theme colours, logo and application icon)
- per-station public chart settings
Built-in protections
- the session cookie is
HttpOnlyandSameSite=Lax - a first-visit cookie banner offers equally accessible accept, reject, and close controls; reject/close preserves the necessary-only default, the choice lasts 180 days, and the footer's Review cookie choices control makes consent as easy to withdraw as to give
- every page footer offers Day theme and Night theme; the first visit follows the device colour preference and an explicit choice is remembered for one year
- state-changing
POST,PUT, andDELETErequests whoseOrigin(orReferer) names a host other than the request host, the forwarded host, or thebaseUrlhost are rejected with403 Cross-site request rejected; setbaseUrlto the URL users actually open - responses carry
X-Content-Type-Options: nosniffandReferrer-Policy: strict-origin-when-cross-origin; cross-origin providers receive only the site origin, while URL paths and query strings remain private - station names, field names, and values coming from MQTT payloads are always rendered as text, including in the home-page map popups
- account requests need a syntactically valid email address
- workflow graphs use a fixed node catalogue, validate every edge and email address, and recheck station access during every watchdog run
- API token secrets are shown once, stored only as hashes, individually revocable, and checked against the owner's current status and rights on every request
- CSV rows with more values than the file header are read without the surplus values
- the station browser table offers every column present in the selected window, also when hourly files have different headers
- Chart.js is loaded from the CDN pinned to major version 4
- non-finite readings (
NaN,inf) are treated as missing in charts, statistics, and the dashboards - if the initial admin account is created with the built-in default or a sample
adminPassword, a password change is required at first login
Security recommendations
- set strong
webSessionSecret(a sample value is never used: a generated secret from the auth DB replaces it) - change default admin credentials
- run behind TLS reverse proxy
- keep the database on secure persistent storage and its URL in a secret store
docs/webgui.md.